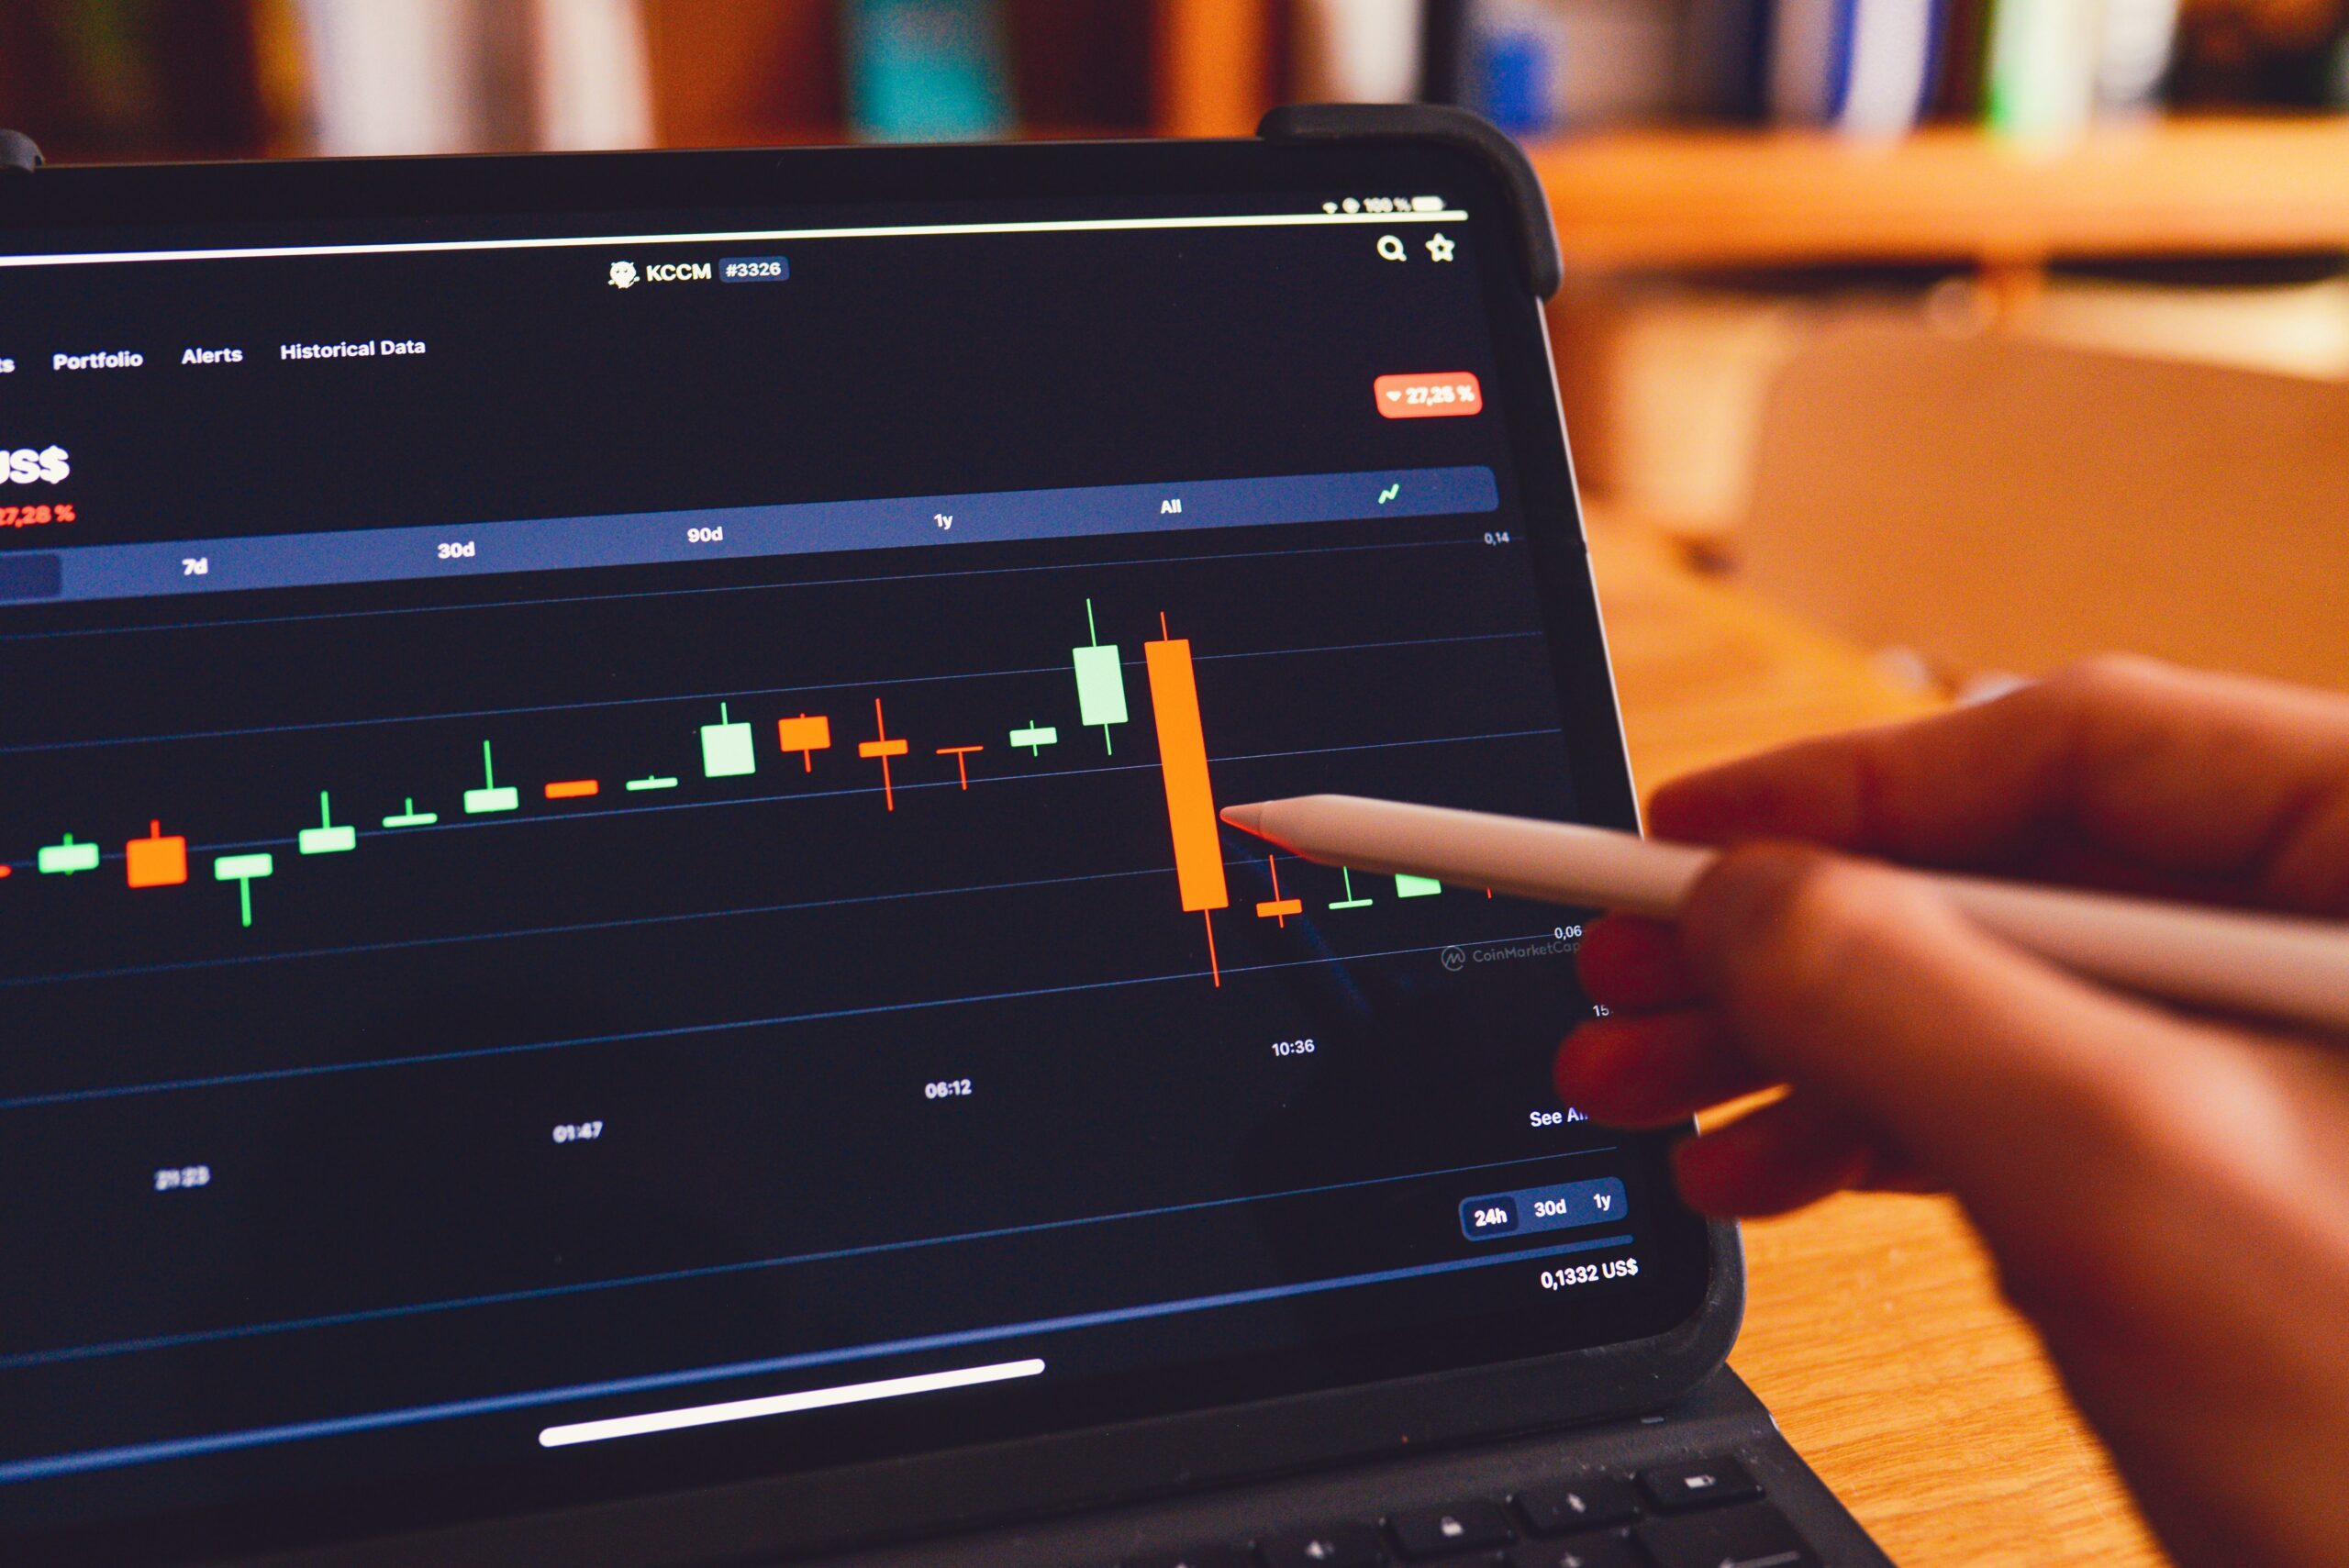
Every quantitative researcher knows the feeling. After weeks of painstaking work, you run the final backtest. The result is breathtaking: a Sharpe ratio of 3.5, minimal drawdowns, and an equity curve that climbs relentlessly from bottom-left to top-right. It’s the perfect strategy. You deploy it to a live market with high hopes, only to watch it bleed capital from day one.
What went wrong? You’ve just become the latest victim of backtest overfitting, the silent killer of promising trading strategies.
Overfitting is what happens when a model doesn’t learn the underlying, repeatable market signal you’re trying to capture. Instead, it effectively “memorises” the random noise and specific idiosyncrasies of your historical dataset. It’s like a student who crams for an exam by memorising the specific answers to a practice test, but collapses when faced with new questions that test the actual concepts.
Your model has become a flawless expert on the past, and is completely unprepared for the future. In today’s highly competitive markets, it is the single greatest threat to a quant’s success.
How Does Overfitting Happen? The Common Traps
Overfitting isn’t a sign of a bad researcher; it’s a natural pitfall of a process that involves intense data mining. It typically stems from three main sources:
- Excessive Complexity (Curve-Fitting): This is the classic trap. Your initial strategy idea shows promise, but isn’t perfect. So you add a rule. Maybe a moving average filter. Then a day-of-the-week filter. Then a rule that avoids trading if the VIX is above 20. Before you know it, you have a dozen parameters, each one added to fix a specific historical drawdown. The result is a brittle strategy perfectly sculpted to the past.
- Data Snooping & Selection Bias: This can be subtle and often unintentional. It occurs when a researcher’s prior knowledge of the data influences the strategy design process. You might notice a particular asset performed well between 2018 and 2020 and unconsciously build a model that excels in that period, or test dozens of ideas and only pursue the one that happens to look good on the data you have.
- In-Sample Optimisation: Running thousands of parameter combinations on a dataset and simply cherry-picking the single best-performing result is a guaranteed path to overfitting. That “optimal” set of parameters is almost certainly the one that best capitalised on random noise.
The Quant’s Toolkit: A Disciplined Defence Against Overfitting
Fighting overfitting requires moving beyond a simple backtest and adopting a rigorous, multi-stage validation process. Your goal is not to find the “best” backtest, but to build confidence that your strategy has a genuine edge.
1. Isolate Your Validation Data (Out-of-Sample Testing)
This is the most fundamental rule. Before you begin, split your historical data into at least two sets:
- In-Sample (IS): The data you use for initial research, discovery, and parameter tuning.
- Out-of-Sample (OOS): A separate, sacred dataset that your model does not see at all during the development phase.
You only run your finalised strategy on the OOS data once, at the very end. If its performance collapses compared to the in-sample test, your model is likely overfit, and you must discard it. Honesty here is critical.
2. Simulate Real-World Trading (Walk-Forward Analysis)
A more robust and realistic technique is walk-forward analysis. This method better simulates how a strategy would have actually performed over time. The process is iterative:
- Optimise: Find the best parameters on an initial window of data (e.g., 2018-2019).
- Test: Trade the strategy with those parameters on the next window of unseen data (e.g., 2020).
- Shift & Repeat: Move the entire window forward (optimise on 2019-2020, test on 2021) and repeat the process until you have covered your entire dataset.
This method tests if your strategy is adaptable and if the logic holds across different market regimes, rather than just on one static block of time.
3. Test for Robustness (Cross-Validation & Reality Checks)
- Monte Carlo Simulation: Introduce randomness into your backtest. What happens if you shuffle the order of your trades? Or slightly alter the historical prices? A robust strategy’s performance should degrade gracefully, not fall apart completely.
- Parameter Sensitivity: How sensitive is your strategy to its parameters? If changing a moving average from 48 to 50 causes the entire strategy to fail, your edge is likely an illusion. A genuine edge should be present across a range of similar parameters.
4. Embrace Simplicity (Occam’s Razor)
In quantitative finance, the simplest explanation is often the best. A model with three strong, logical parameters will almost always be more robust in live trading than a convoluted model with fifteen. Every parameter you add increases the model’s degrees of freedom, making it easier to overfit. Always ask: “Is this parameter capturing a real economic or behavioural phenomenon, or is it just fixing a past drawdown?”
Discipline and the Right Tools
Overcoming the threat of overfitting is less about finding a magic statistical formula and more about enforcing a disciplined and honest research process. It requires treating your hypotheses with scepticism and rigorously challenging your own results.
It also requires the right tools. A professional-grade backtesting engine—one that facilitates walk-forward analysis, provides access to clean, extensive datasets, and allows for sophisticated sensitivity analysis—is not a luxury. It is an essential part of the modern quant’s defence against the silent killer of overfitting. By combining a rigorous mindset with powerful technology, you can build the confidence needed to move a strategy from a beautiful backtest into a profitable reality.


Leave a Reply